Last Friday, the German National Garden Show BUGA 23 opened in perfect weather. The number of visitors exceeded all expectations. Within the Smart Roots project, we participated at the exhibition area of Smart City Mannheim GmbH, a joint venture of the City of Mannheim and MVV Energie AG.
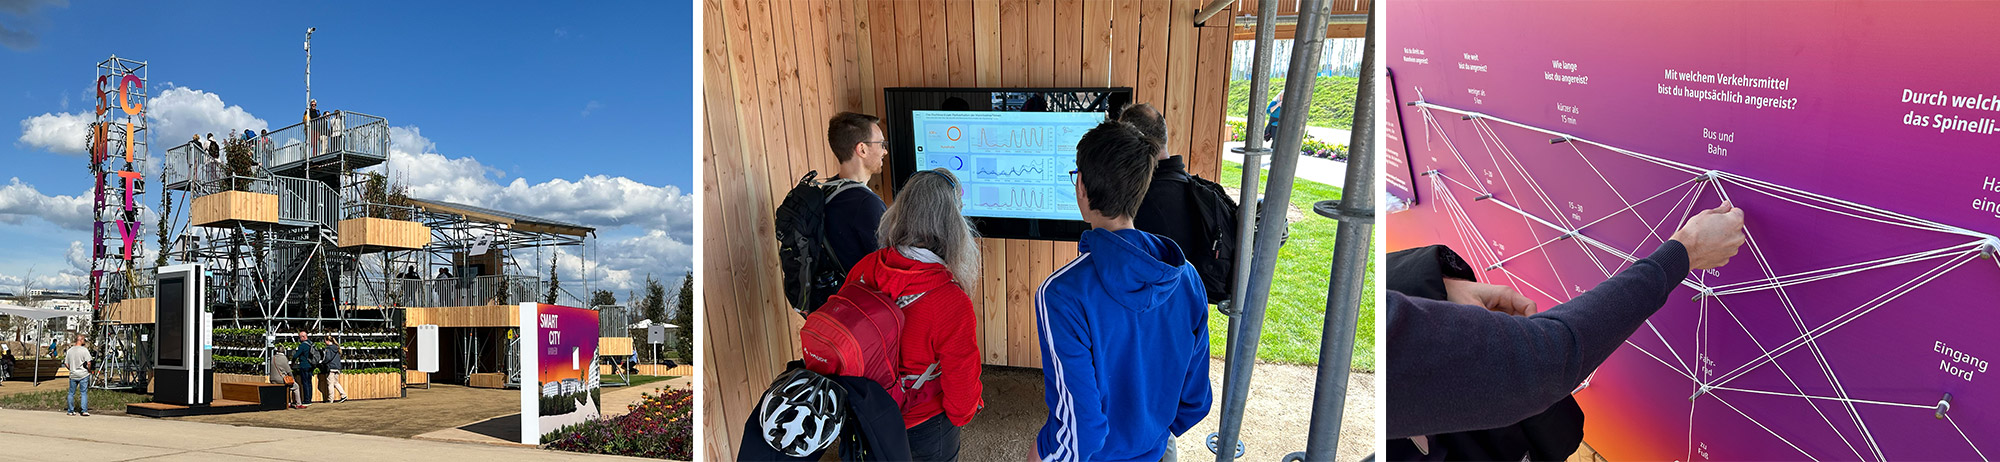
Exhibition area at BUGA 23 (photo by Die Wegmeister) with one of the real-time dashboards, and the participatory physicalization wall.
In the exhibition area, visitors can access real-time data from the city of Mannheim through two large interactive displays. The focus is on two crucial aspects that impact daily life in the city: parking behavior and air quality. The Smart City Dashboard, a collaborative effort between Mannheim University of Applied Sciences and MVV, with support from the University of Mannheim, presents the live data in easy to understand diagrams. Visitors can observe patterns such as peak visitor days at BUGA 23 or the air quality on weekends. These visualizations increase citizens’ understanding about parking behavior and air quality in Mannheim, sparking discussions about urban development and sustainability. The data used for these visualizations is sourced from the Urban Data Platform of Smart City Mannheim, collected in real-time from various locations across the city. The dashboards complement our concept of Data Experience Points located throughout the city.
To make the abstract concept of data tangible in a simple and physical way, the University of Mannheim and the University of Hamburg, with the support of Mannheim University of Applied Sciences, have developed a project aimed at raising awareness among visitors about the connection between collected data, sustainability, and their own role in it. At one wall, visitors can document their travel routes to the BUGA 23 as data traces. How did you arrive? How long did the journey take? How far is the starting point? Visitors respond to these questions by connecting their individual answers with a thread. This creates traces of the visitors’ mobility data, collectively forming a dataset. The goal is to help participants develop an understanding that their own behavior is reflected in the collected data and that it can serve as a basis for urban decision-making. Visitors also have the opportunity to contribute their personal perspectives on the topic by participating in a survey. The results are recorded and evaluated, and will be shared later on.
The aim of the Smart City exhibition concept is to raise awareness and provide information to visitors in a playful and interactive manner about pressing contemporary issues and data-driven solutions. It is designed to cater cater to all visitors, regardless of their level of digital literacy or experience, ensuring inclusivity for everyone.
Credits
Smart City Dashboards
- Lead by Christoph Huber (HDIL)
- Design by Sophie Humbert (HDIL) and Veronique Dill (Smart City Mannheim)
- Development by Marius Berlinghof and Viktoria Wermke (MVV)
- Parking data clustering by Christian Schreckenberger (University of Mannheim)
- Supervised by Till Nagel (HDIL)
Participatory Physicalization
- Lead by Lisa Pfeiffer (University of Mannheim and University of Hamburg)
- Design by Lisa Pfeiffer and Die Wegmeister
- Construction by Die Wegmeister
- Supervised by Laura Marie Edinger-Schons (University of Hamburg), with support by Till Nagel (HDIL)